 |
| Aug 2015 added |
 |
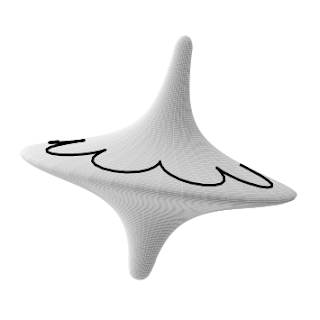
| The python code to generate this fig is here. |
----
2016/Jan 15
教illustrator不如教3d computer drawing
簡單2D畫圖->小畫家(點陣圖)缺點:放大會糊掉
向量2D繪圖Inkscape(向量圖)放大不會糊掉
但大家都知道,若要畫立體的東西,在平面上作圖是比較困難的,你的3d空間感要很好。
複雜的立體物件就更難在平面上畫出來了,這時候就要其他有效率的方式。
但常常我們要畫的東西都是立體的阿
電腦輔助繪圖computer aided drawing/design
-> 3d繪圖空間->讓你可以在3d空間中作畫
可以在電腦建立的3D虛擬空間中作圖
一般這種電腦輔助繪圖軟體
AutoCAD, Maya, 3ds Max 等等
很貴!!
有沒有免費的方法呢?有很多
也歡迎大家舉薦
我這邊野人獻曝的跟大家分享我使用的免費方法
用python程式語言作3d繪圖
利用python的3d繪圖指令庫matplotlib
可以畫出讓你滿意的3d向量圖
此方法並非傳統的所見及所得
而是所見及所要
比如說
你要一個線段 是要給個指令像這樣draw_line(pointA,pointB)
然後執行後才會看到結果
所以得要知道pointA,pointB的位置
那AutoCAD的3D繪圖軟體Inventor的話就是所見及所得
先在3D空間中訂出你要的繪圖平面(是2D的)然後再到這個繪圖平面上繪圖。
所以基本上還是在2D平面上繪圖,只是你可以變換你的繪圖平面
你可以想像的到這方法會有一些限制
因為每次你都必須在一個2D平面上作圖
不過好處是畫出來你可以馬上看到
一篇介紹各種各樣向量繪圖軟體的文章,整理得相當好。
3D動畫師(地域級)
待續...
-----
2014/July
由於不想買好貴好貴的向量繪圖軟體,也不想用盜版的,因為現在有些學校提供的防毒軟體會去殺盜版軟體的安裝檔,因此現在要用盜版的也不容易啊。用了一下免費的Inkscape發現並不適合我需求,我需求是必須能有在三度空間中繪圖的功能,見以上第二圖。免費的3D向量編輯軟體好像是有一些,但與其花那個時間去學,我決定還是土法煉鋼自己來試試看吧(也想要能夠擺脫連小地方都一直在倚靠仰賴歐美的好用軟體產品,我們自己也應該要能在小地方慢慢獨立。)因此我用python程式語言來畫3D三維的向量圖形,最終在輸出成平面圖檔如png,平面向量圖檔pgf,eps等。發現其實並沒那麼花時間。把一些常用的功能,畫線段,畫弧線的指令,寫出來,並且只要朝向指令重複使用化的方向去寫code,基本上只要寫一次,以後就剪下貼上嚕。這邊把code分享給大家,希望大家試試看,或提供點意見!! 一步一步慢慢地朝向本土化自給自足邁進!!
The figures here are being typeset into this manuscript and this manuscript, using Xelatex with TeX life 2013. And because my document is latex, I saved the above figures in PGF format using Python pgf backend support (\usepackage{pgf}). I found it very useful. So truly thanks to those who contributed to the pgf latex support in Python!
Some hindsight (still amending): I used to use the software Origin and Matlab to draw my research data on charts. But they are not free, and are actually somehow expensive. After I learned a language Python I realized, hmm, perhaps what we learned in school, like Matlab or MS words, powerpoint, etc, are probably not the best choices to learn during education. Although a programming language is not easy to learn, I somehow feel it is worth while to learn because we will need to make graphs and create text documents and maybe create professional typeset documents our whole life. A programming language is not meant to learn in 1 or 2 years, but learning is a life-long process, so there is no need to learn it in just 1 or 2 years. We can extend the learning period to 5 to 10 years, and still have plenty of time to apply it because we will need to deal with documents all our life.
---------------------------------------
Some open issues with mplot3d in Matplotlib, Python:
2014/7/21
Keywords: 3D CAD, 3D vector graphs
推薦延伸閱讀:
用python繪製3d內切內接圓
http://whymranderson.blogspot.tw/2015/04/tetrahedron-midsphere.html
推薦延伸閱讀:
用python繪製3d內切內接圓
http://whymranderson.blogspot.tw/2015/04/tetrahedron-midsphere.html


No comments:
Post a Comment